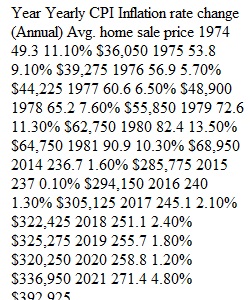


Q Each student will post an Excel spreadsheet to Canvas that provides original data organized in a chart, and displays data in a graph. Guidelines for data collection: • Data must be publicly available, or, you must have permission in writing to share that data publicly. • Projects are not going to be submitted to the IRB for approval, thus must focus on publically available data or surveys. • Sources must be properly cited. • Do not simply use statistics provided in a published study. • No experiments on humans or animals are permitted. Please click the link above to submit the Data Collection portion of the SEA Course Project. For grading expectations please view the rubric. Rubric MAT308/312 Data Collection MAT308/312 Data Collection Criteria Ratings Pts This criterion is linked to a Learning OutcomeChart 33 pts Exemplary Data clearly organized in well-labeled chart. 28.4 pts Developing Labels need revised. 22.4 pts Beginning Needs major revision. 0 pts Missing 33 pts This criterion is linked to a Learning OutcomeGraph 33 pts Exemplary Appropriate, well-labeled graph. 28.4 pts Developing Graph needs some revision. 22.4 pts Beginning Needs major revision. 0 pts No Marks 33 pts This criterion is linked to a Learning OutcomeSources 34 pts Exemplary Sources properly cited in APA format. 28.4 pts Developing Sources need some revision to meet APA guidelines. 22.4 pts Beginning Needs major revision. 0 pts missing 34 pts Total Points: 100 PreviousNext
View Related Questions